Using Advanced Dataflow
The Advanced Dataflow window is a powerful tool that allows designers to explore the connectivity of an active design and analyze dataflow among instances, concurrent statements, signals, nets, and registers during simulation. The hierarchical, flat, or gray dataflow diagram displayed by the Advanced Dataflow Viewer may be especially helpful while tracing events propagating through the entire project and identifying those that may be potential sources of unexpected output values.
This document shows how to use advanced dataflow using one of our sample designs Freq_meter.
Advanced Dataflow
To open the design, go to File | Open workspace/design explorer and choose Freq_meter under Active-HDL/samples/VHDL_Designs. After opening the design, go to the test bench folder and set the testbench (entity/architecture) pair as the top level, as shown in Figure 1.
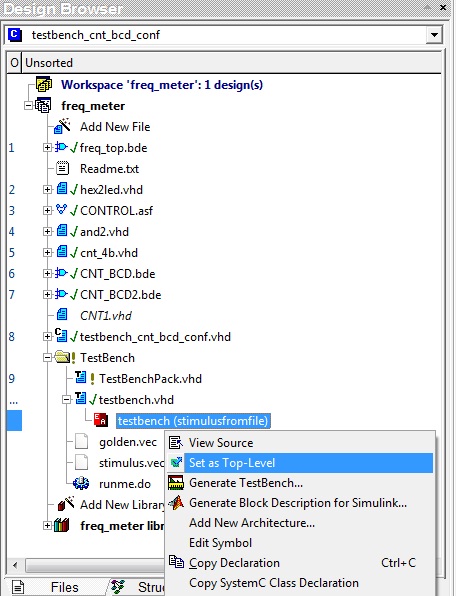
Figure 1
Before initializing simulation and adding signals to advanced dataflow, there are some settings that need to be done. Go to Tools | Preferences | Advanced Dataflow and choose the following settings (Figure 2). Make sure to check the Generate data for Advanced Dataflow as it is required for advanced dataflow to work successfully.
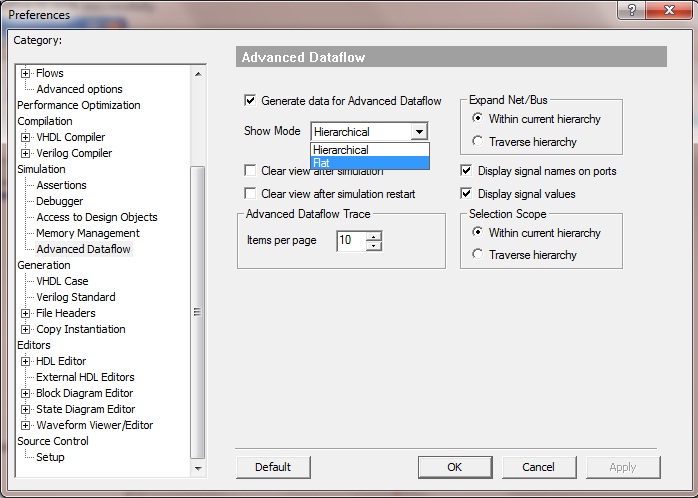
Figure 2
Initialize the simulation. In the Structures tab in the Design Browser tab, select freq_top and choose GATE signal from the bottom window. Right click and choose Add to Advanced Dataflow as in Figure 3.
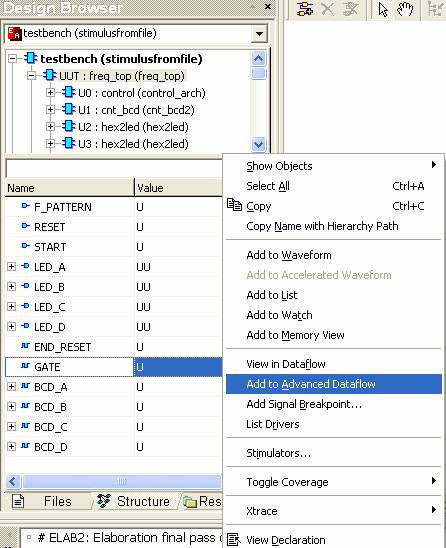
Figure 3
An advanced dataflow window will appear which will have the GATE signal in the flat mode as shown in Figure 4.
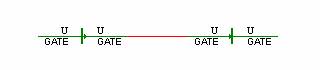
Figure 4
There are three modes of view in Advanced Dataflow:
Hierarchical
Flat
Gray
The user can switch between flat mode and hierarchical mode using the  icon. Turning on the hierarchical
mode for the above selected gate signal in the advanced dataflow will display the following diagram (Figure 5)
where UUT/U0 and cnt_bcd are connected using the GATE signal from the top-level unit under test.
icon. Turning on the hierarchical
mode for the above selected gate signal in the advanced dataflow will display the following diagram (Figure 5)
where UUT/U0 and cnt_bcd are connected using the GATE signal from the top-level unit under test.
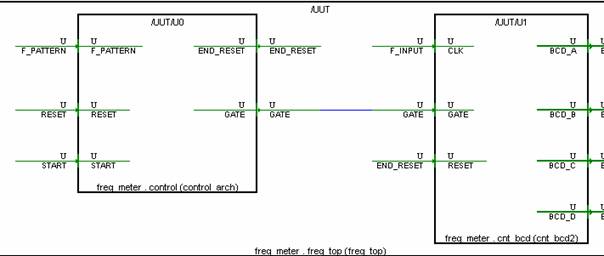
Figure 5
The Gray mode is particularly helpful to distinguish items being traced and make them easy to recognize especially on large dataflow diagrams in complex designs. The gray mode can be turned on using the icon. After turning the gray mode ON, choose LED_A and right click and choose X-way. This will gray out all other blocks and only the blocks that are traced will be highlighted in blue, as shown in Figure 6.
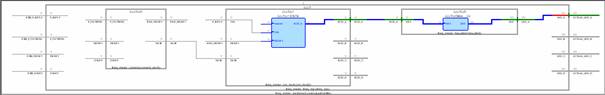
Figure 6
Choosing a particular signal in the advanced dataflow window and right clicking, the user can choose one among many options as below to explore connectivity of a simulation model and trace events propagating through the entire project (Figure 7).
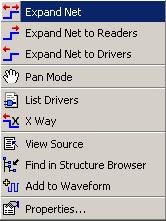
Figure 7
Expand Net
Displays objects that are connected to the selected net and read and update it. Depending on the Advanced Dataflow Preferences, the selected net can be expanded with a different scope; either only to boundaries of the current hierarchy (Within current hierarchy) or through the entire hierarchy (Traverse hierarchy). Double-click can be used alternatively.
Expand Net to Readers
Displays objects that read the selected net. If you choose this option then the net you have pointed to will be expanded through subsequent hierarchy levels and all statements that are updated by this net will be displayed.
Expand Net to Drivers
Display objects that update the selected net. If you choose this option then the net you have pointed to will be expanded through subsequent hierarchy levels and all statements that update this net will be displayed.
List Drivers
In order to list all drivers for a particular signal in the console list drivers is used. All the drivers for a particular signal will be displayed in the console. For example, choose LED_C right click and select list drivers. The following drivers will be listed in the console as shown in Figure 8. This will be helpful to analyze multiple driver issues.
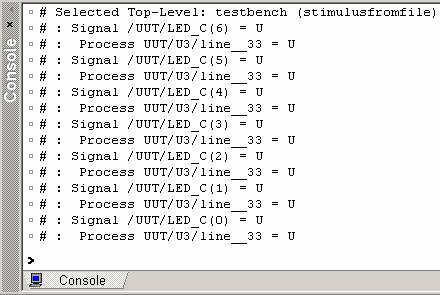
Figure 8
X way
If Xs or Us occur during the simulation, their "source" can be located in the Advanced Dataflow window by selecting the X Way pop-up option. The option explores connections until a statement (or statements) being a source of the unexpected value(s) is found.
The advanced dataflow window is also tightly integrated to other windows like the structures tab, waveform window and the HDL editor. To view the source code of a particular object, the view source can be used. To add an object from the advanced dataflow to the waveform window, add to waveform window can be used.
The same applies to selecting an object in the HDL Editor, Block or State Diagram Editor, legacy Waveform Viewer/Editor, Processes, or Watch window and choosing the Add to Advanced Dataflow pop-up menu command, Add to Advanced Dataflow or Add to Advanced Dataflow Recursively commands from the toolbar.
Advanced Dataflow Trace
Regardless of the selected working mode, the advanced Dataflow window is always synchronized with a dockable toolbox - advanced Dataflow Trace. The advanced Dataflow Trace option is designed for:
Displaying detailed information on design objects (signals/nets, their types, values, and hierarchy, instances, statements, port maps, etc.) selected in the advanced Dataflow window
Finding signals/nets, instances, and HDL statements displayed within the current dataflow diagram
To open the advanced Dataflow Trace toolbox, choose the View Trace option from the advanced Dataflow menu or
click the toolbar button  . The figure below shows the advanced Dataflow Trace toolbox after selecting LED_C output (Figure 9).
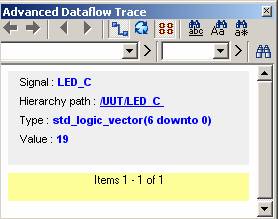
Figure 9
Both windows are synchronized, which means that the selection of a signal in the Advanced Dataflow window provides details on its name, type, value, or a hierarchy path within the design in the Advanced Dataflow Trace toolbox. Similarly, clicking the link brings up the view in the Advanced Dataflow window with the focus set on the selected design object.
The user can run the simulation for a particular time and see the values change on the advanced dataflow dynamically. Go to the console window and type run 20us. The change in GATE value can be observed in the advanced dataflow window below. This is very helpful in debugging the design to see what values are produced during the current simulation time (Figure 10).
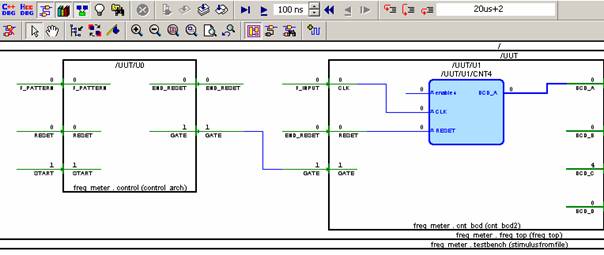
Figure 10
Corporate Headquarters
2260 Corporate Circle
Henderson, NV 89074 USA
Tel: +1 702 990 4400
Fax: +1 702 990 4414
https://www.aldec.com
©2026 Aldec, Inc.